Everything on this page is intended for public distribution. Anyone is welcome to download, distribute, and share images presented here crediting the "THESAN Simulations" or "THESAN Collaboration". For any commercial (non-academic) uses please contact us first.
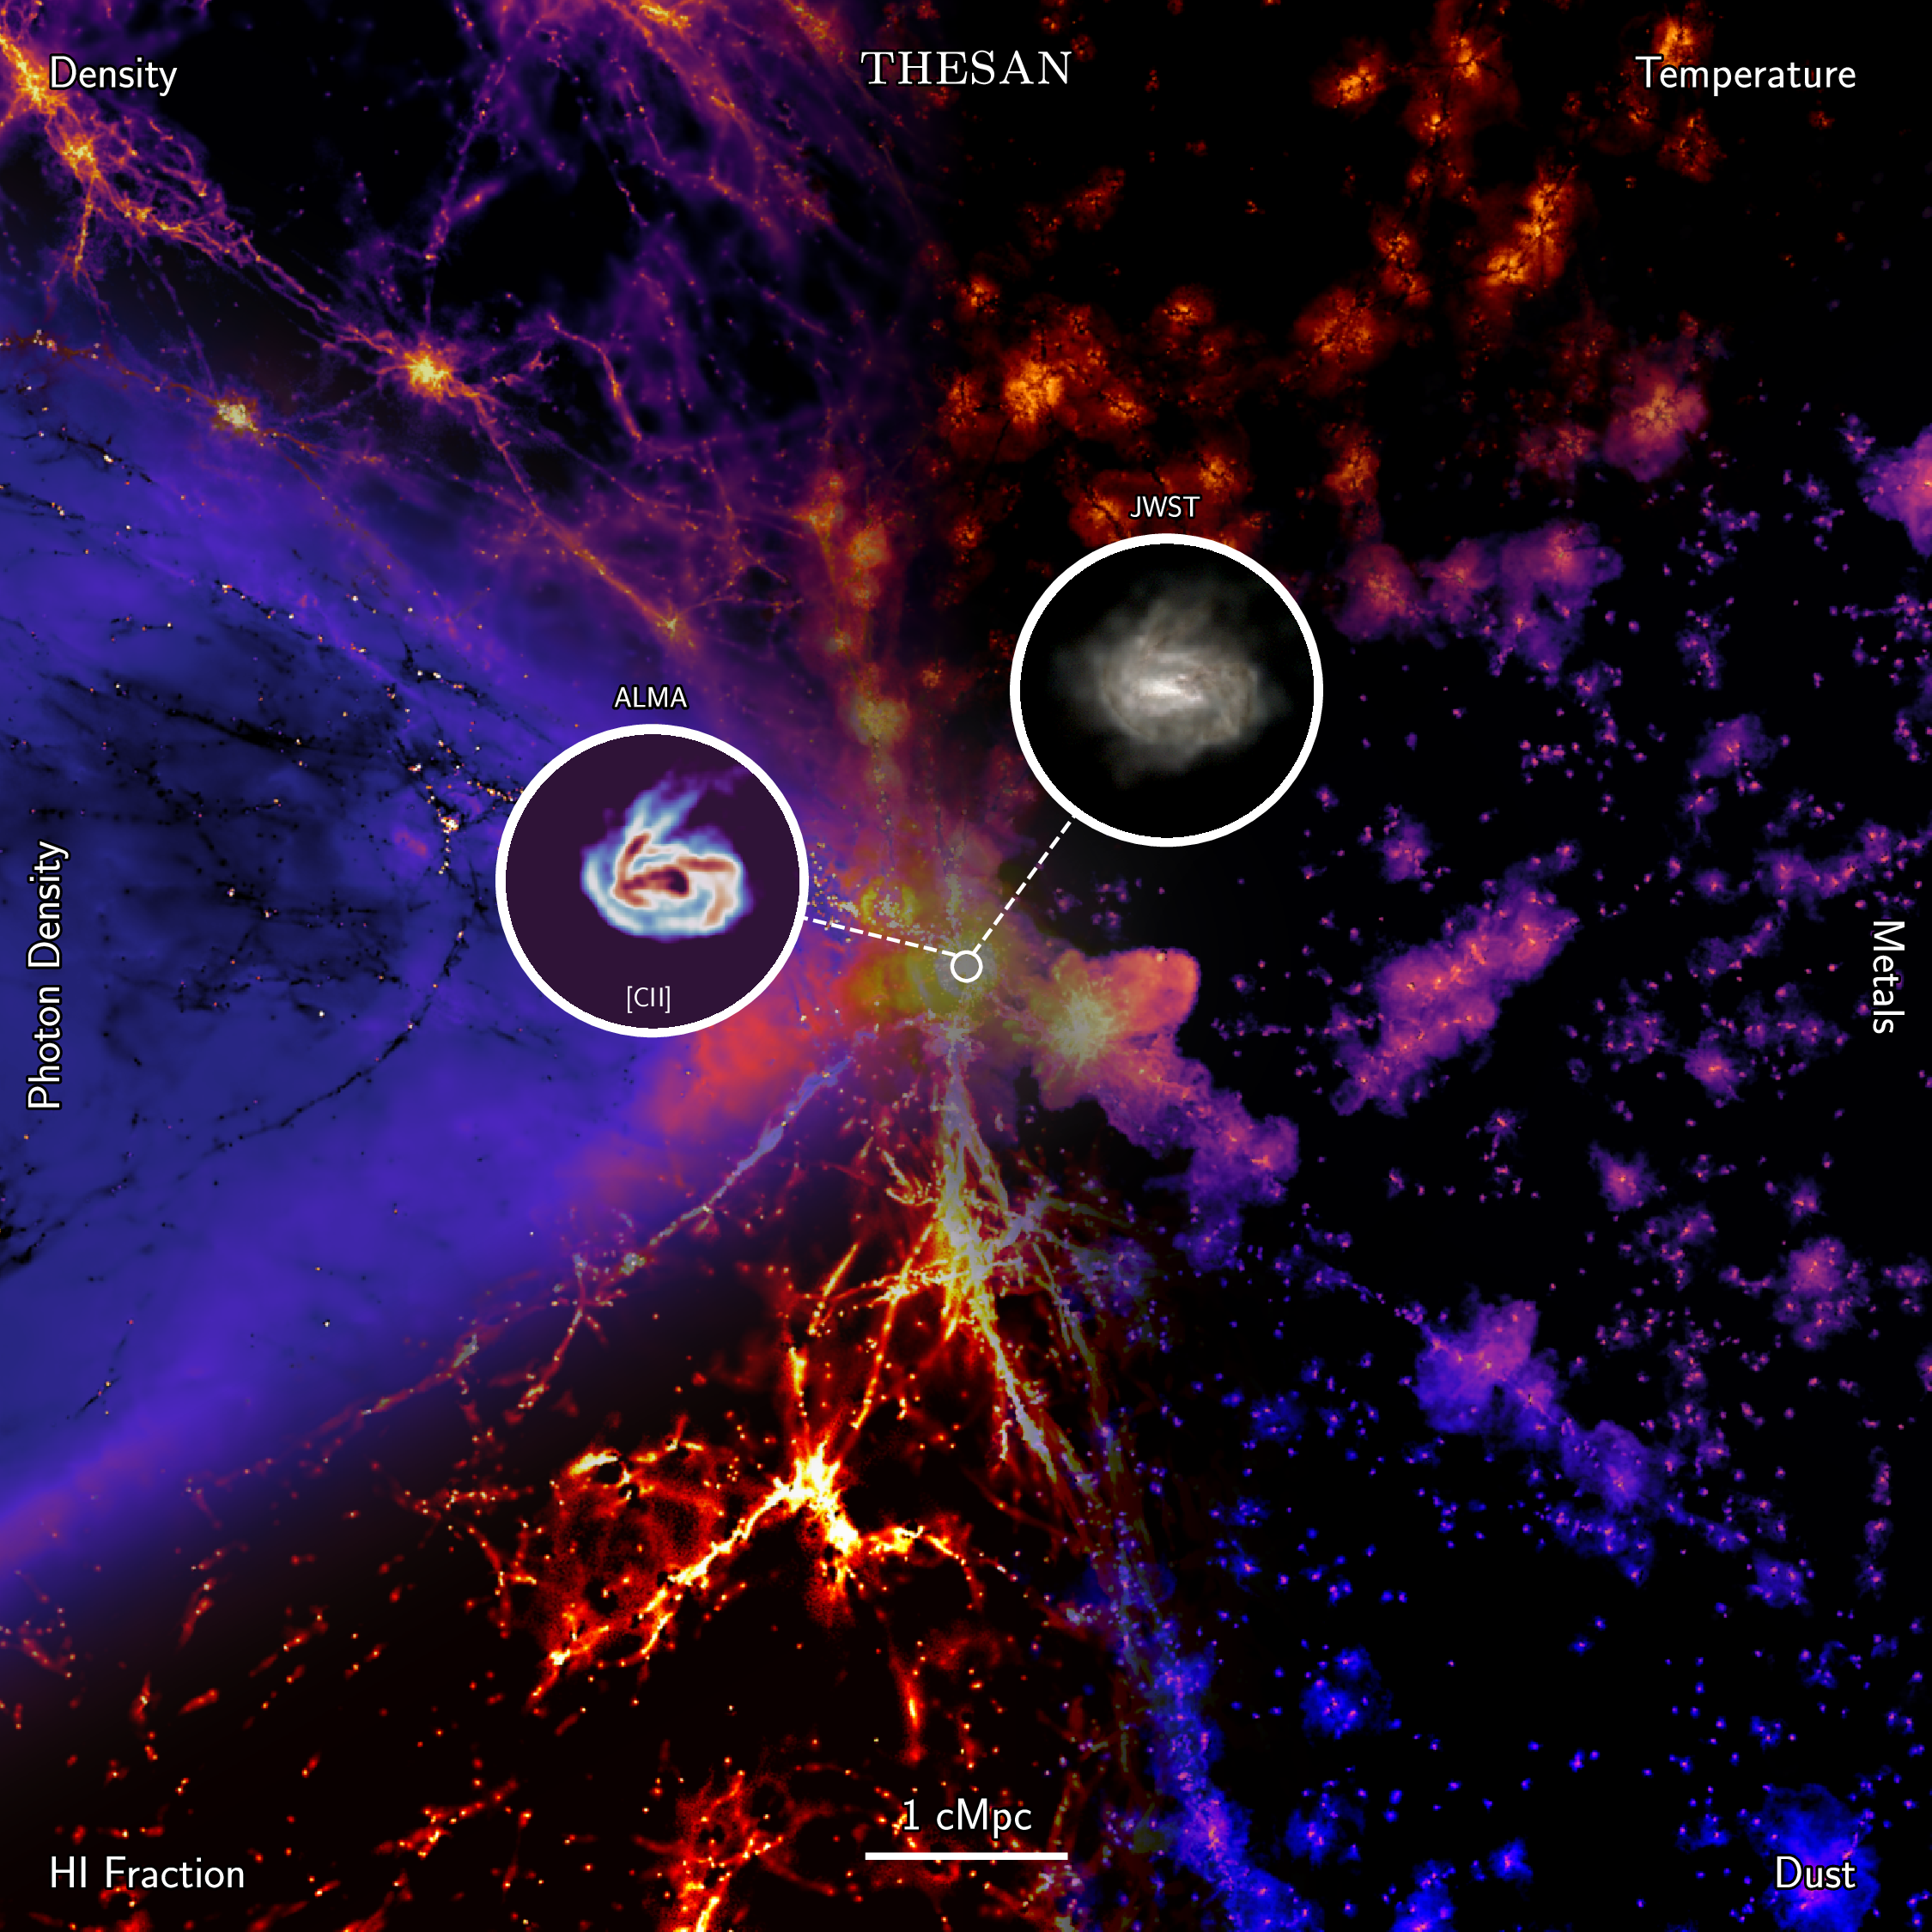
View of different simulated properties in a slice through the main Thesan simulation (from top right in clockwise order: gas temperature, metal mass, dust mass, HI fraction, photon density and gas density).
The two circular insets show how the largest galaxy in Thesan would look like if observed through the James Webb Space Telescope wide filters and through the ALMA telescope. The image shows the wide range
of properties self-consistently captured by the Thesan simulations on a large dynamical range.
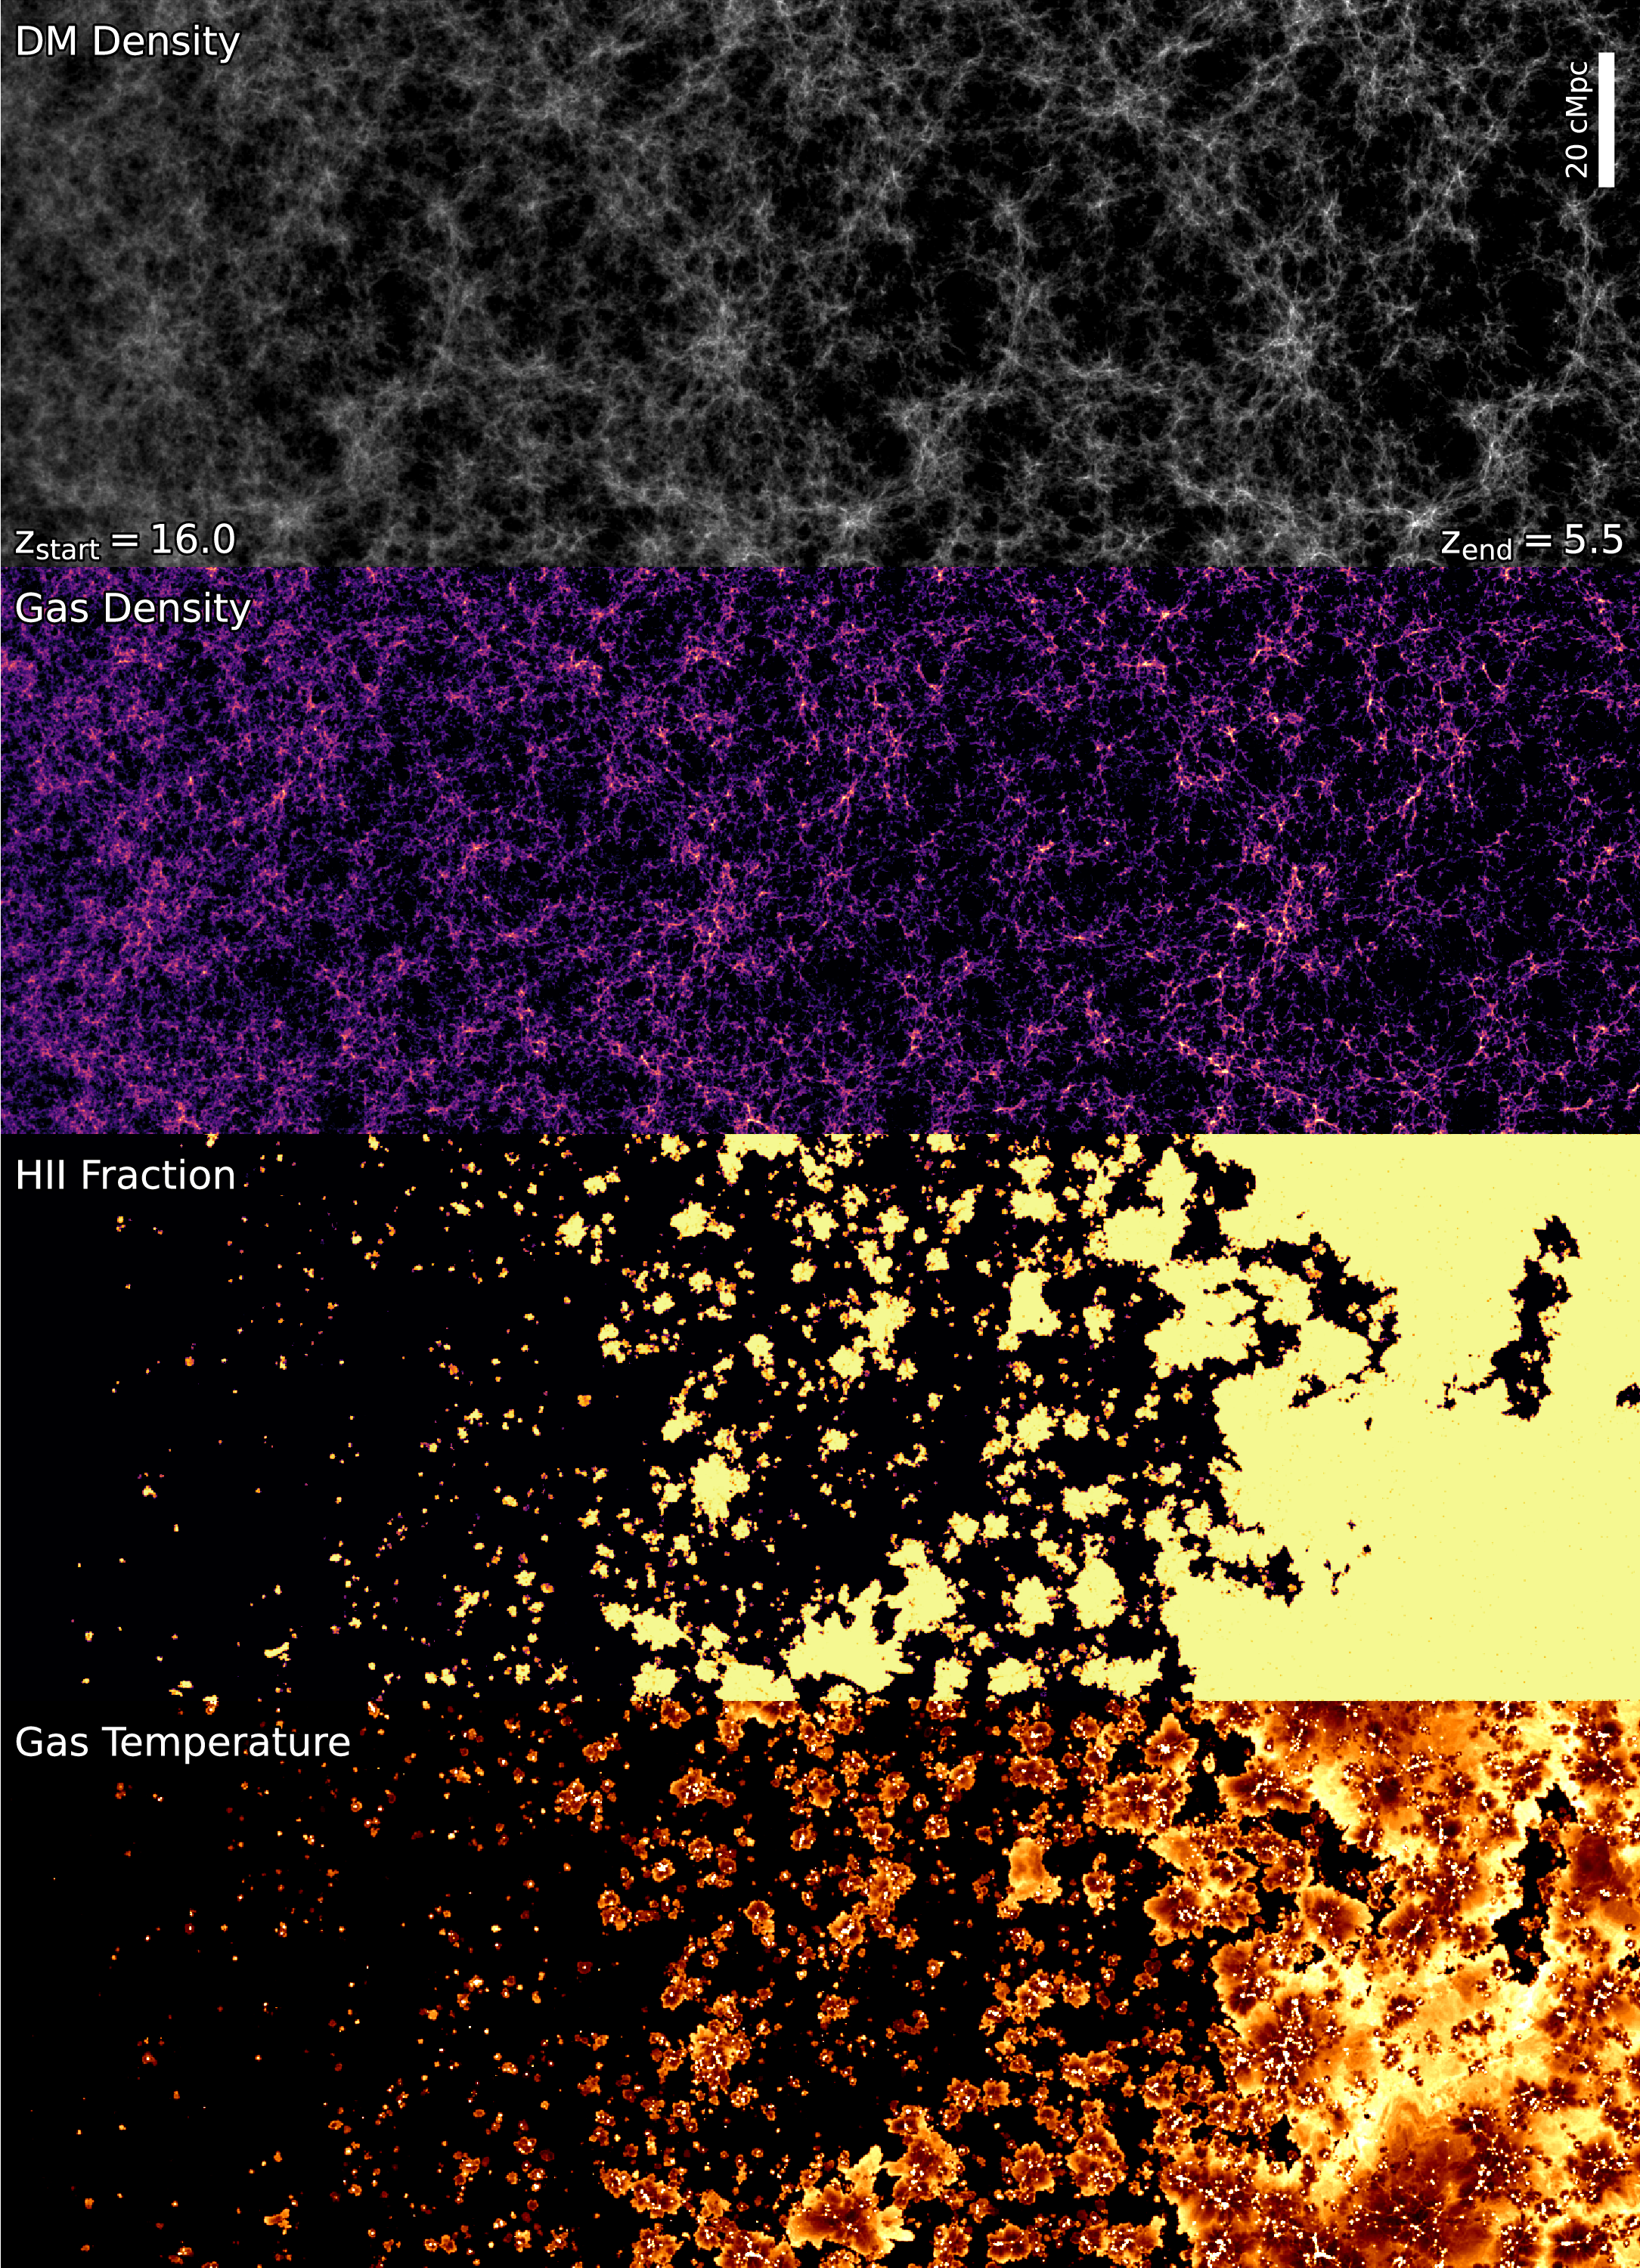
Evolution of simulated properties in the main Thesan run. The time flows from left to right. The dark matter (top panel) collapse in the cosmic web structure, composed of clumps (haloes) connected by filaments, and
the gas (second panel from the top) follows, collapsing to create galaxies. These produce ionising photons that drive cosmic reionization (third panel from the top), heating up the gas in the process (bottom panel).
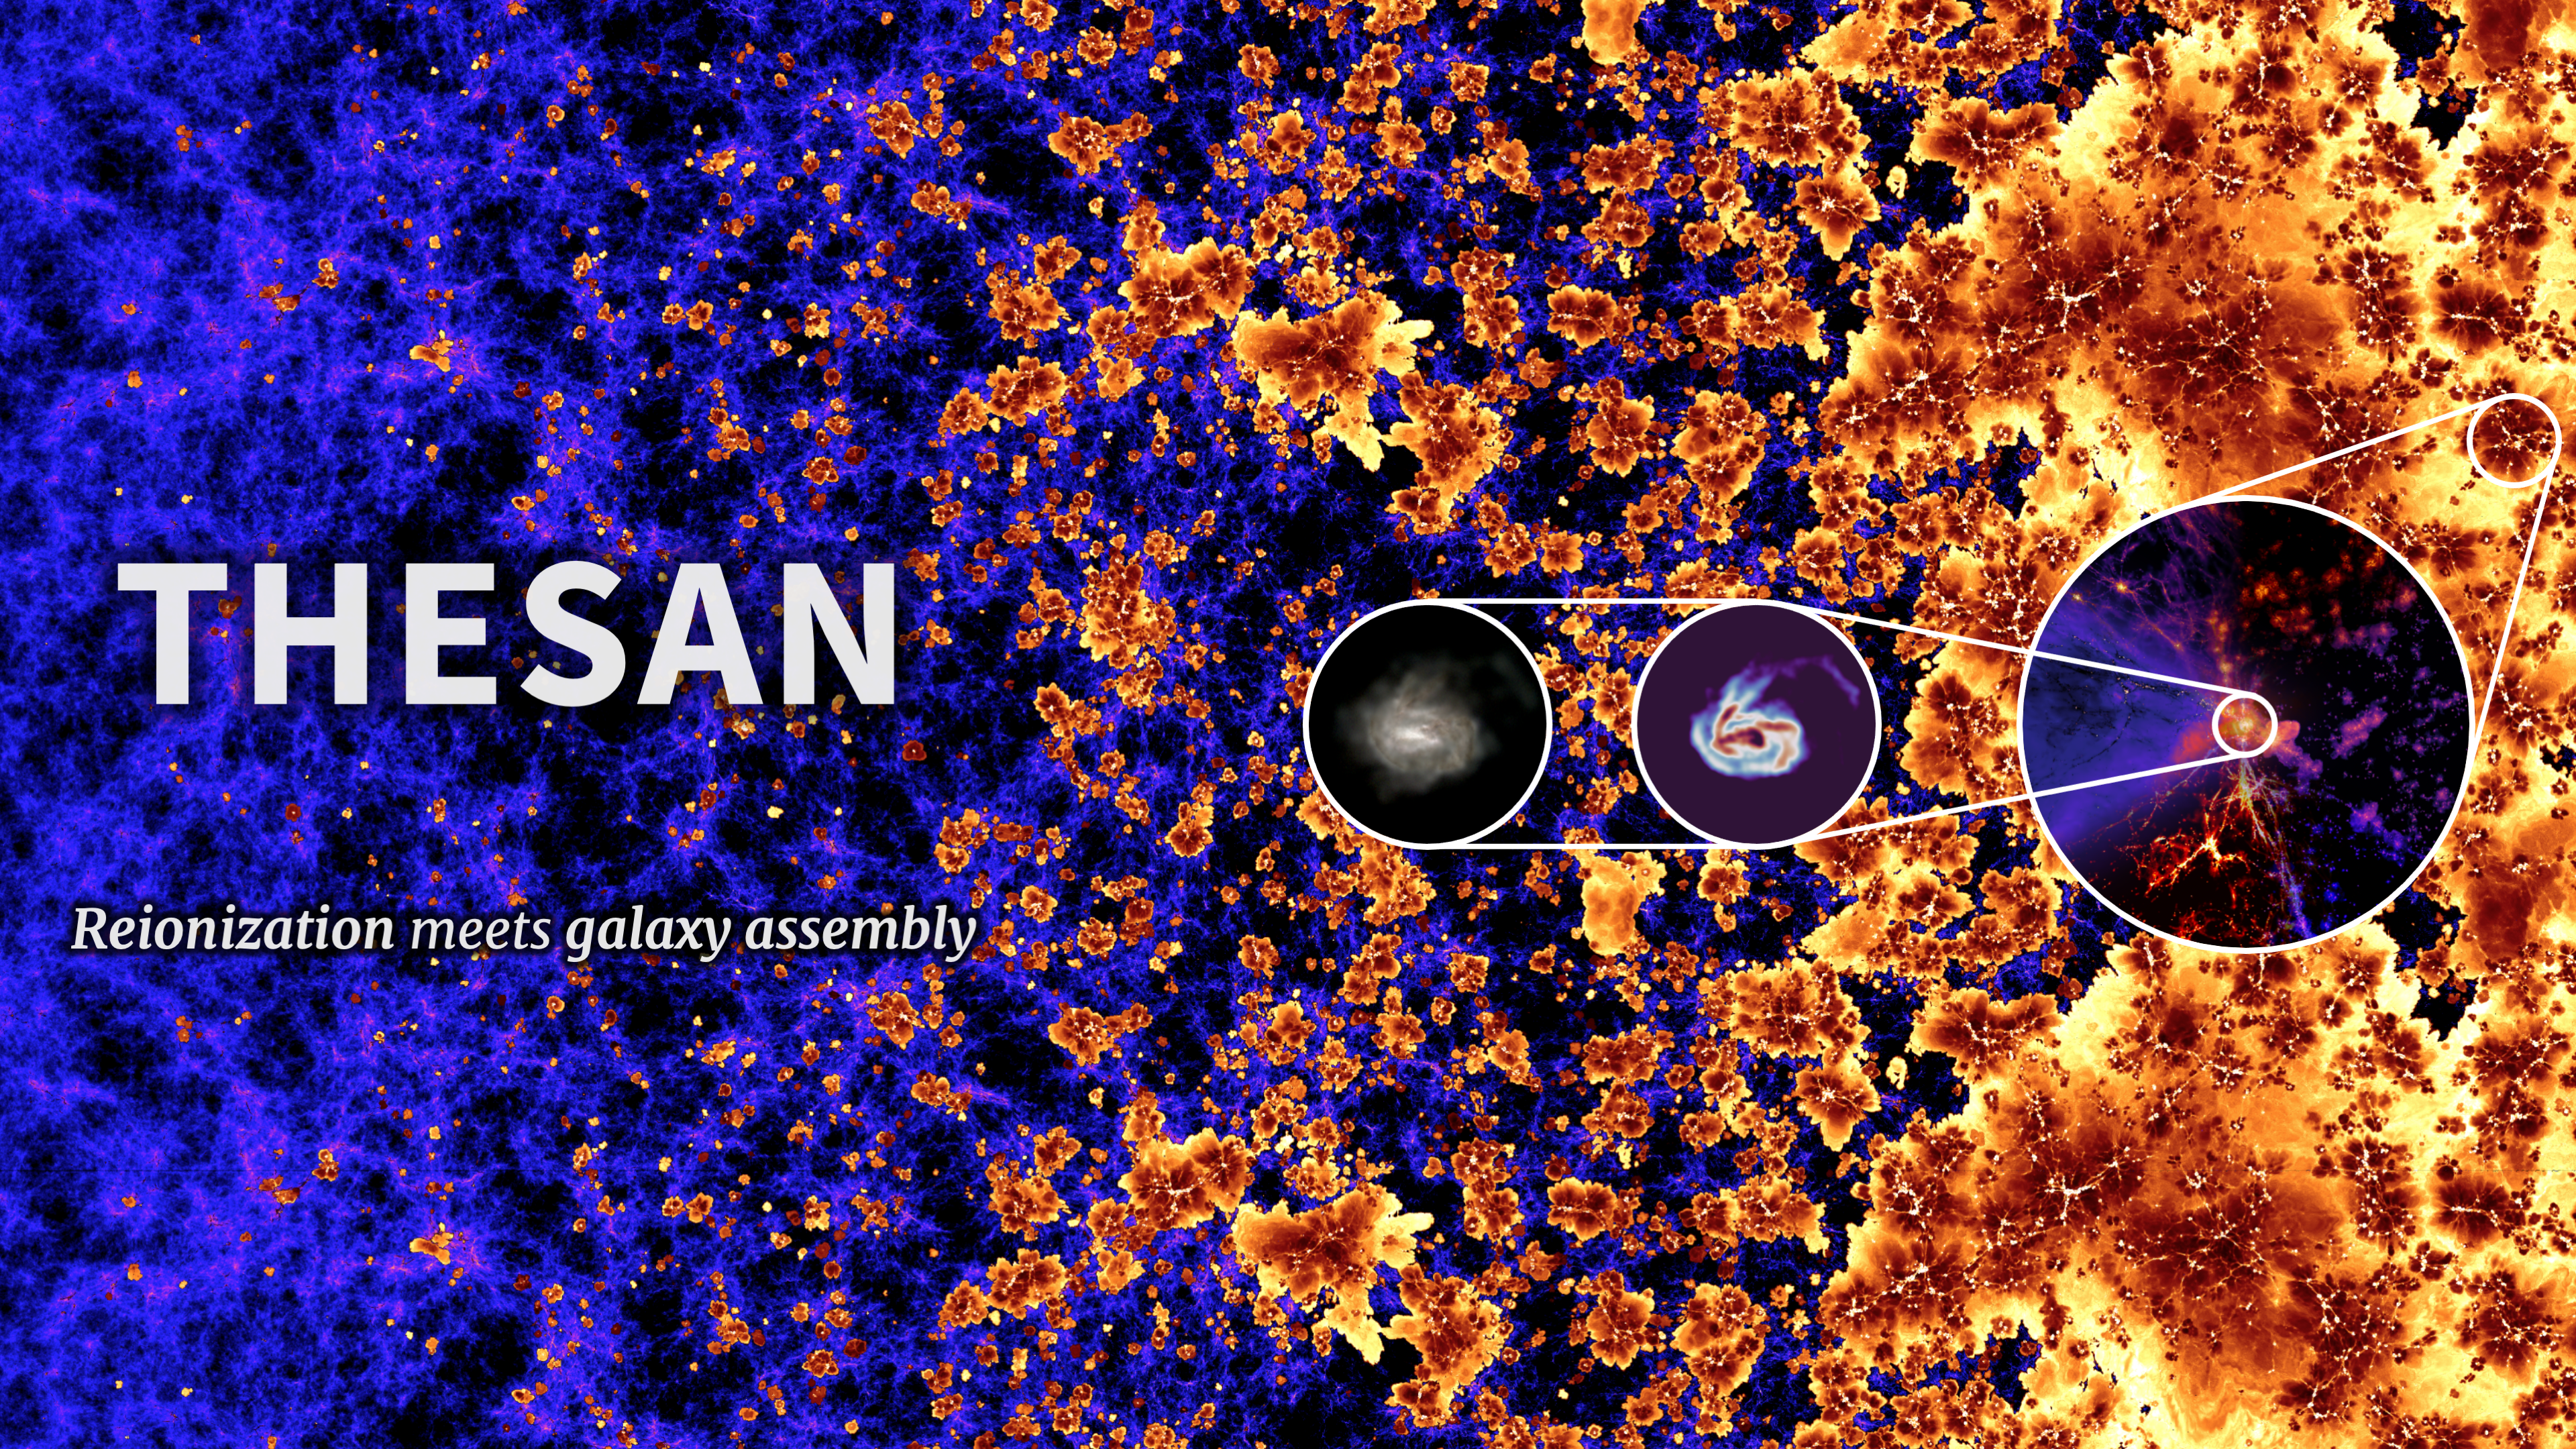
Summary banner combining the two previous images of the lightcone-like evolution and caleidoscopic views. The zoom-in region shows a galaxy environment at z~5.5 with further zoom-in insets showing the galaxy as would be seen by the JWST and ALMA observatories.
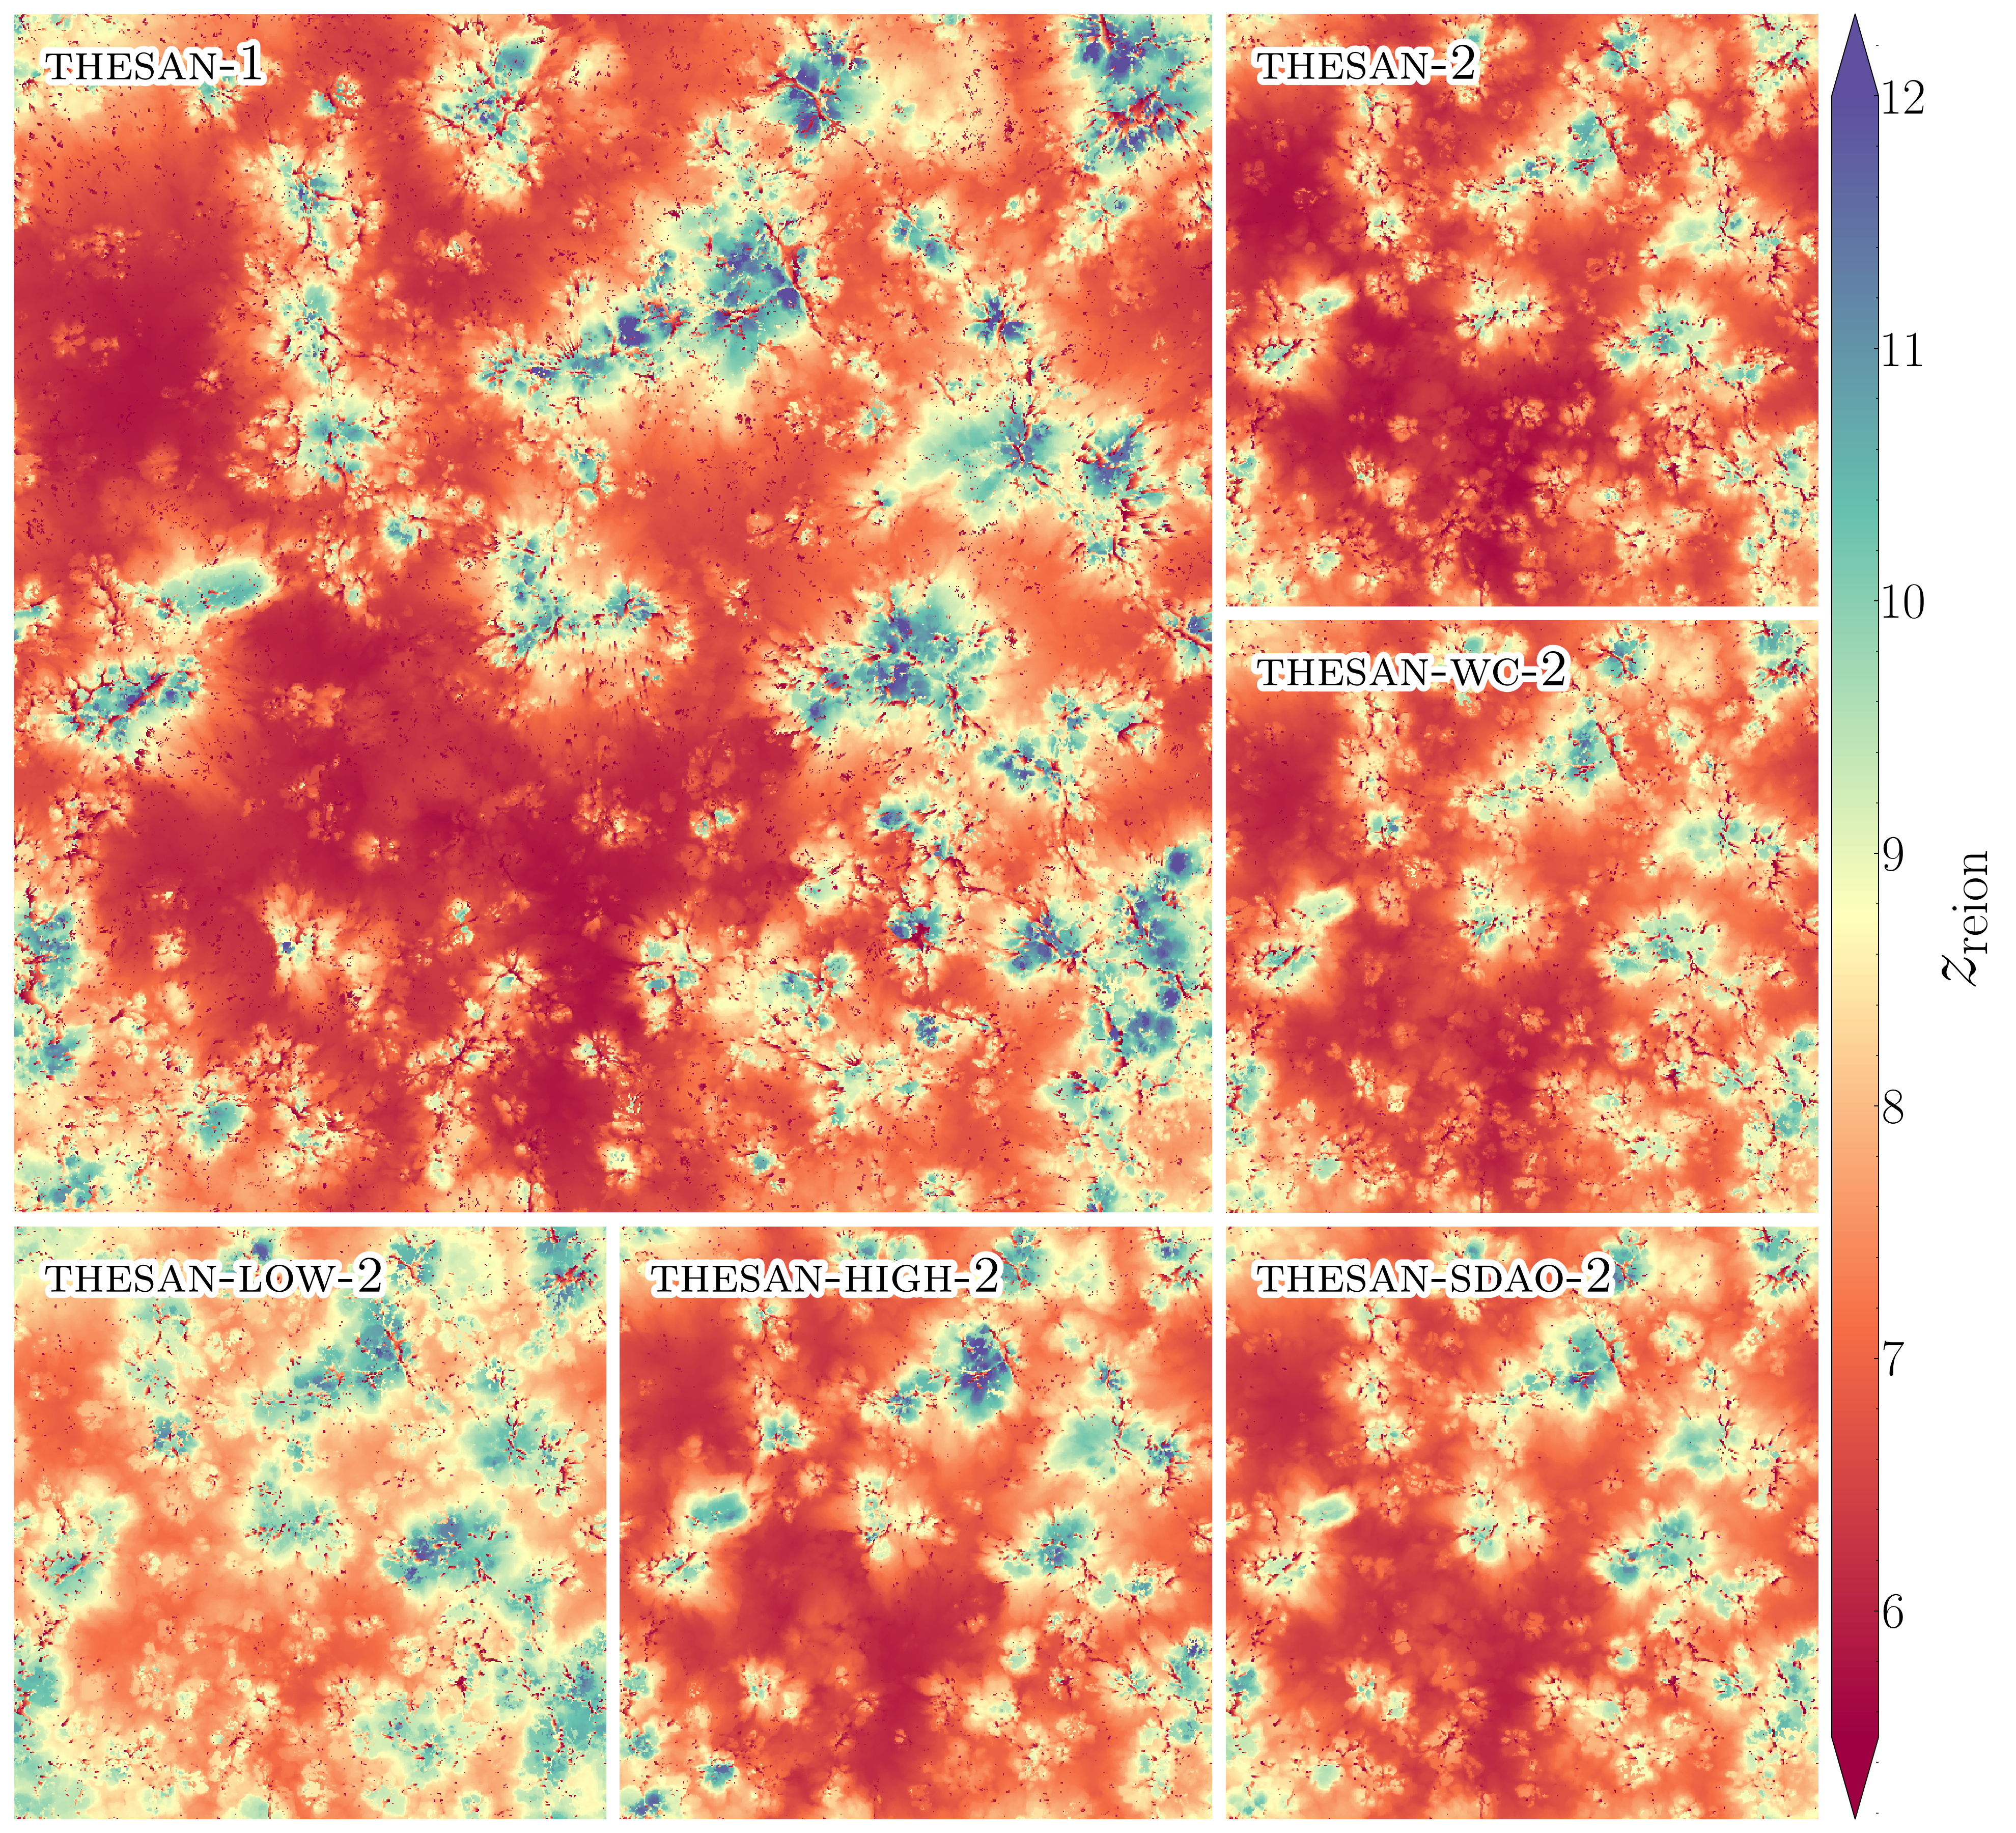
Reionization redshift of the gas in the Thesan runs. The reionization redshift is defined as the latest time the local HII fraction has crossed the threshold value 0.99 from below.
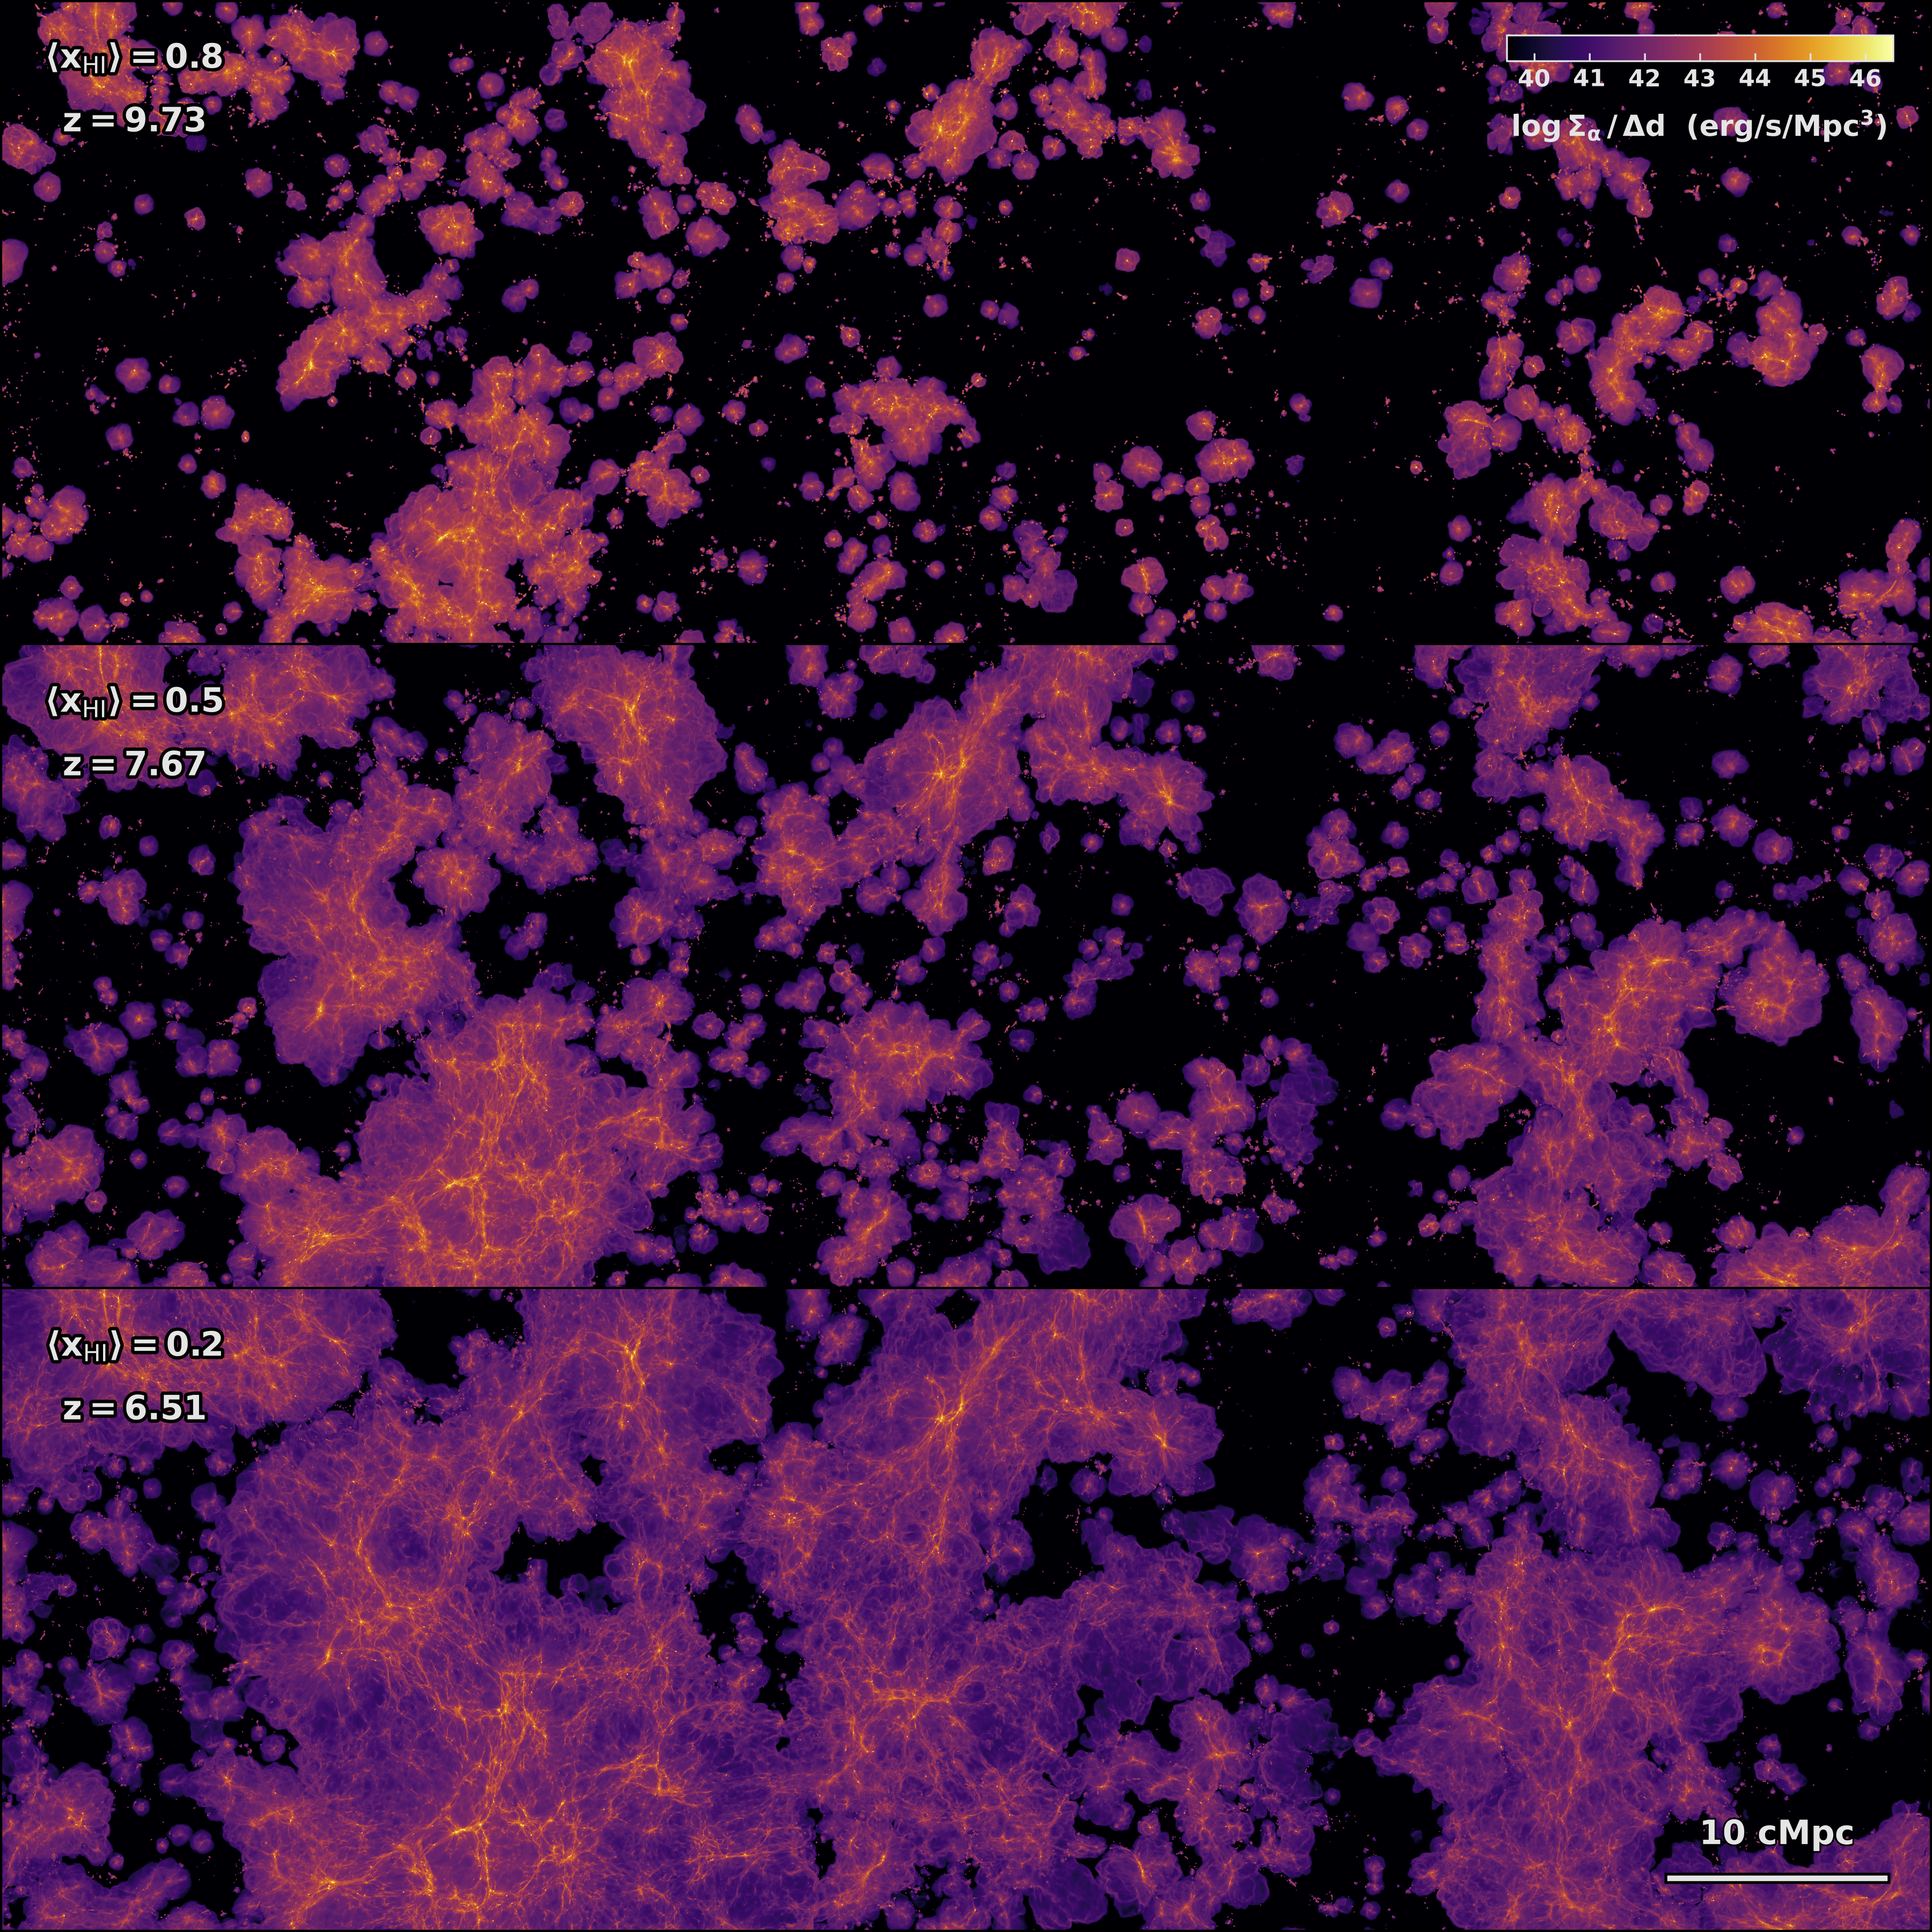
Intrinsic Lyα surface brightness over a 90×30×3 cMpc3 sub-volume for redshifts when the global neutral hydrogen fractions are xHI ≈ (0.8, 0.5, 0.2). Emission is connected both reionization topology and large-scale structure.
Lyman-alpha emitting galaxy
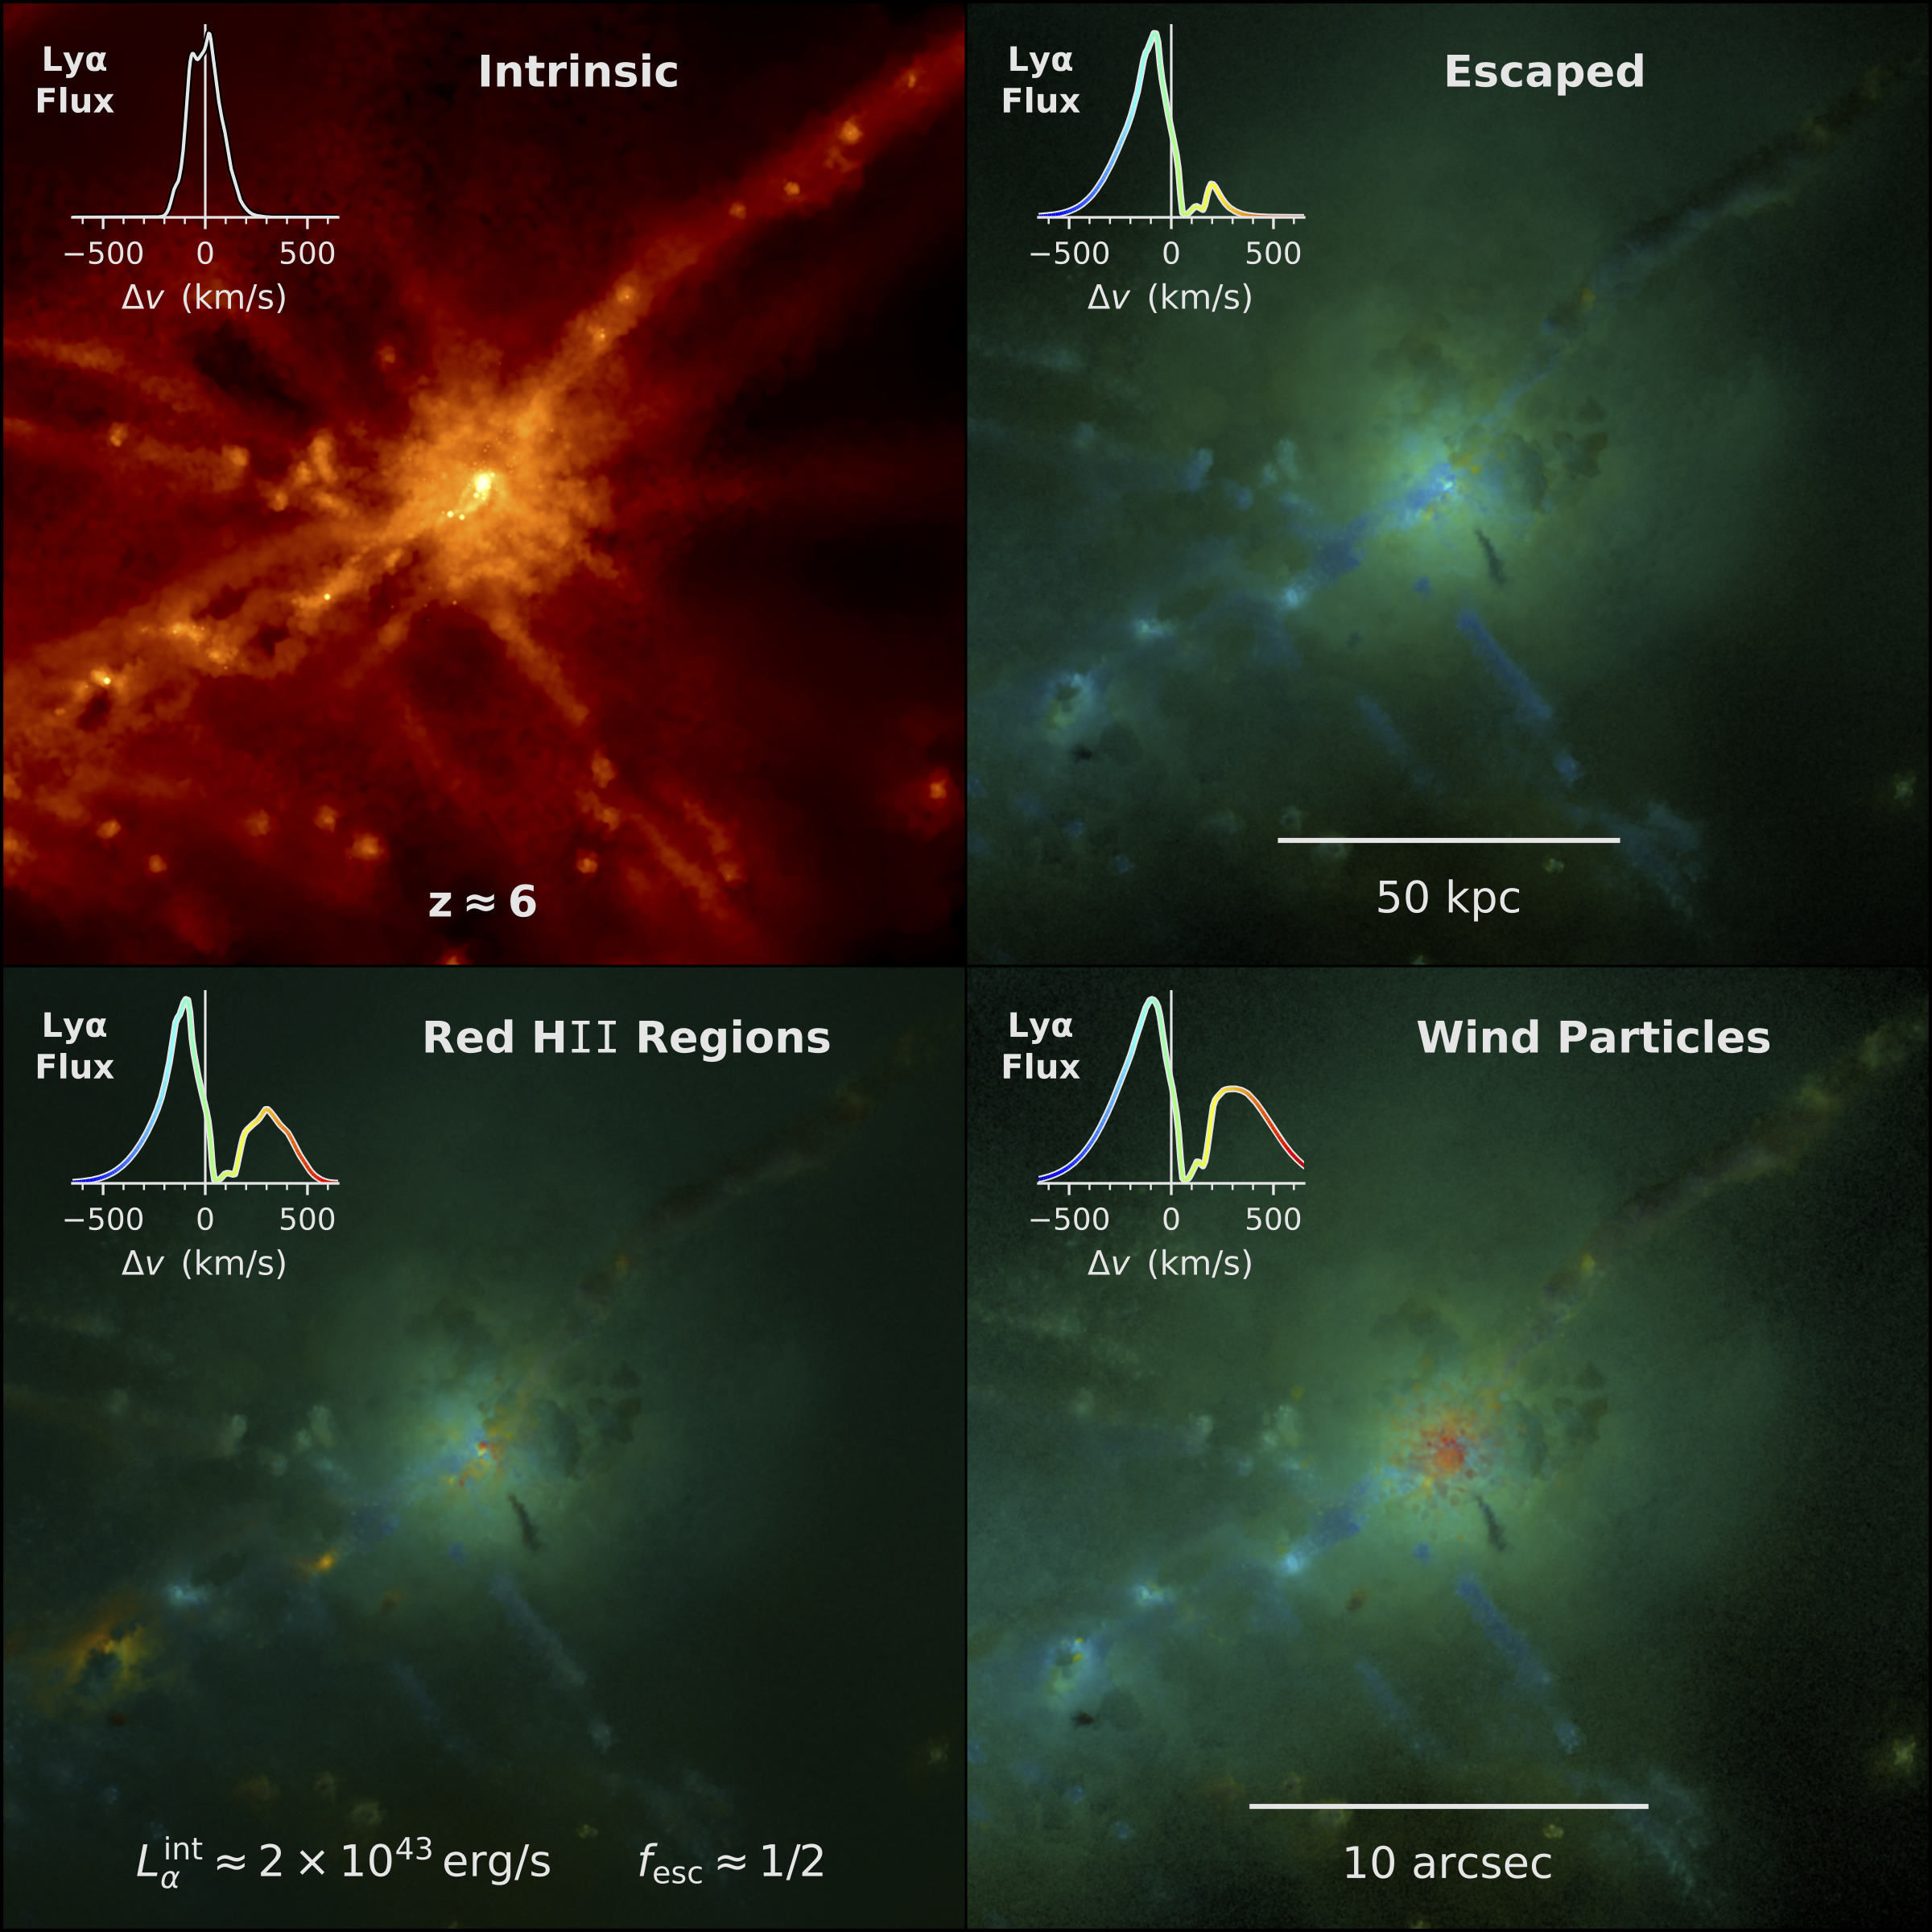
Upper panels: Intrinsic Lyα surface brightness for a galaxy of mass Mhalo≈1011M☉ at z=6, along with a false color rendering of the escape Lyα emission based on synthetic integral field unit (IFU) data generated with the COLT Monte Carlo radiative transfer code. Lower panels: Alternate emission models with (i) reddened sub-resolution HII regions and (ii) wind particles to mimick galactic winds.
JWST galaxies and Lya flux
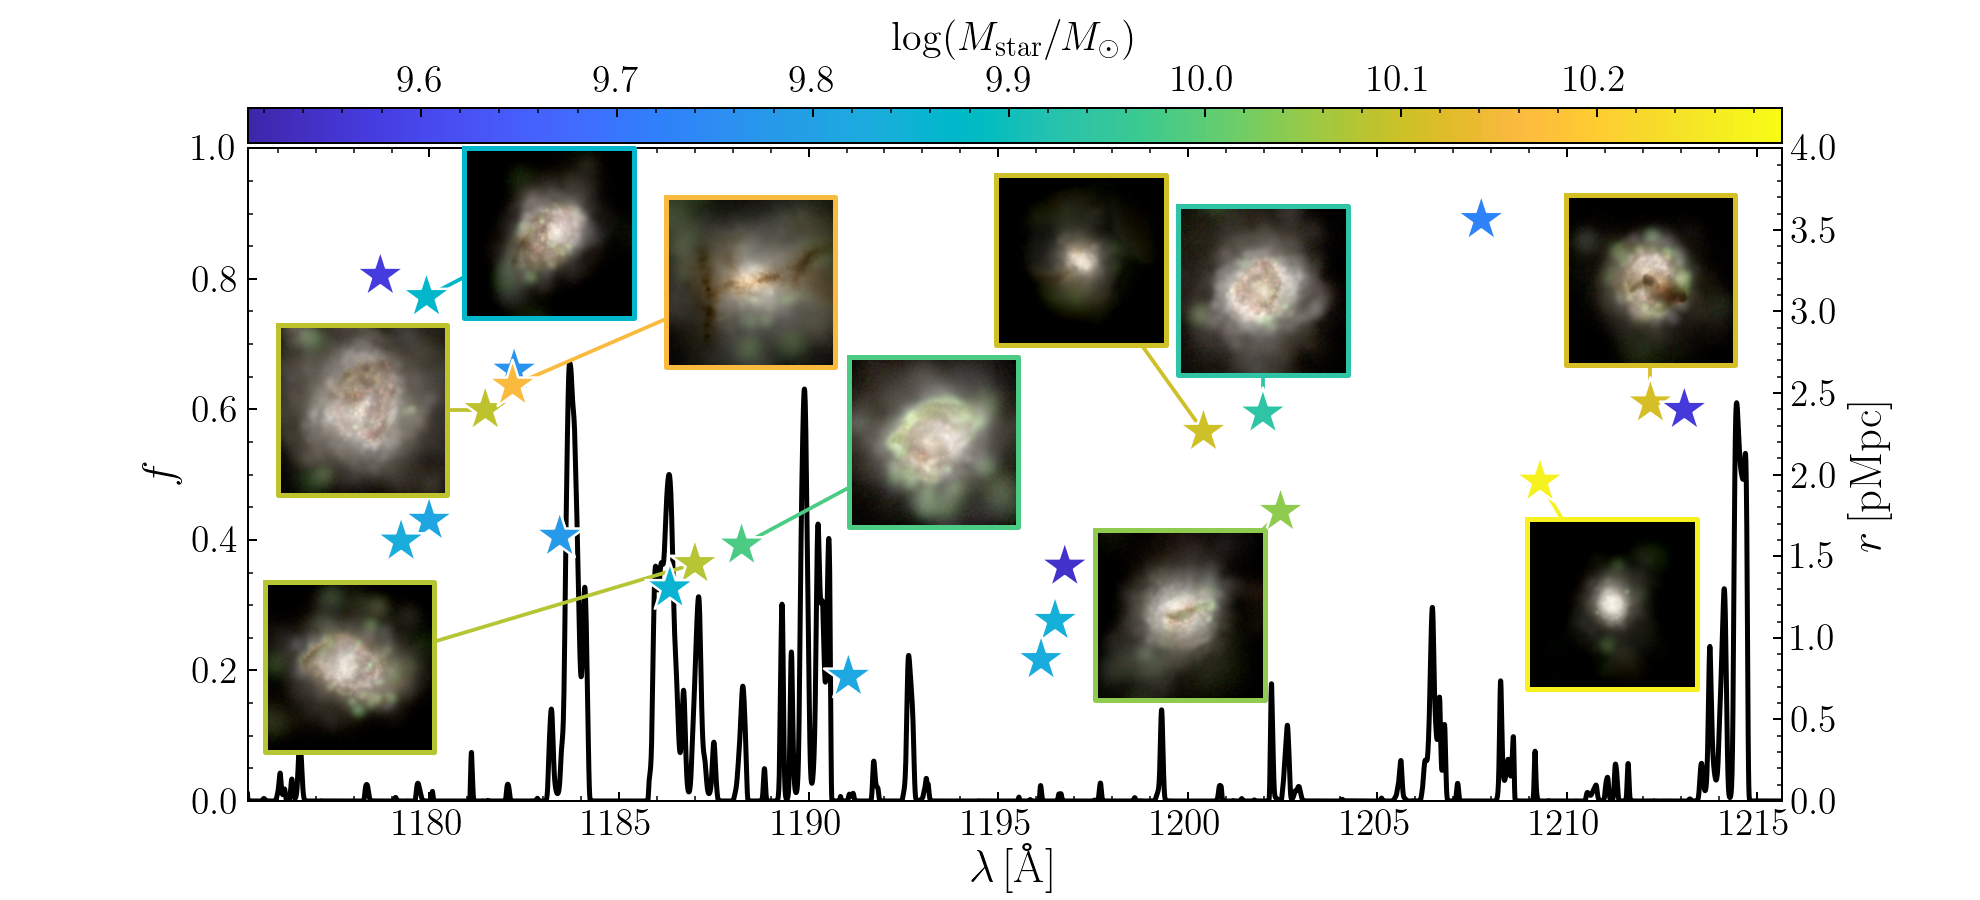
Normalised Lyα transmitted flux along a sightline through the Thesan-1 box (left vertical scale). Star symbols show the surrounding galaxies with large stellar mass (top color bar). Their vertical position reflects their distance from the sightline (right vertical scale). Insets show synthetic JWST mock images of the ten galaxies in the panel with the largest stellar mass, combining the F277W, F356W and F444W NIRCam wide filters and covering an area of(10 pkpc)2.
Ionization of haloes of different size
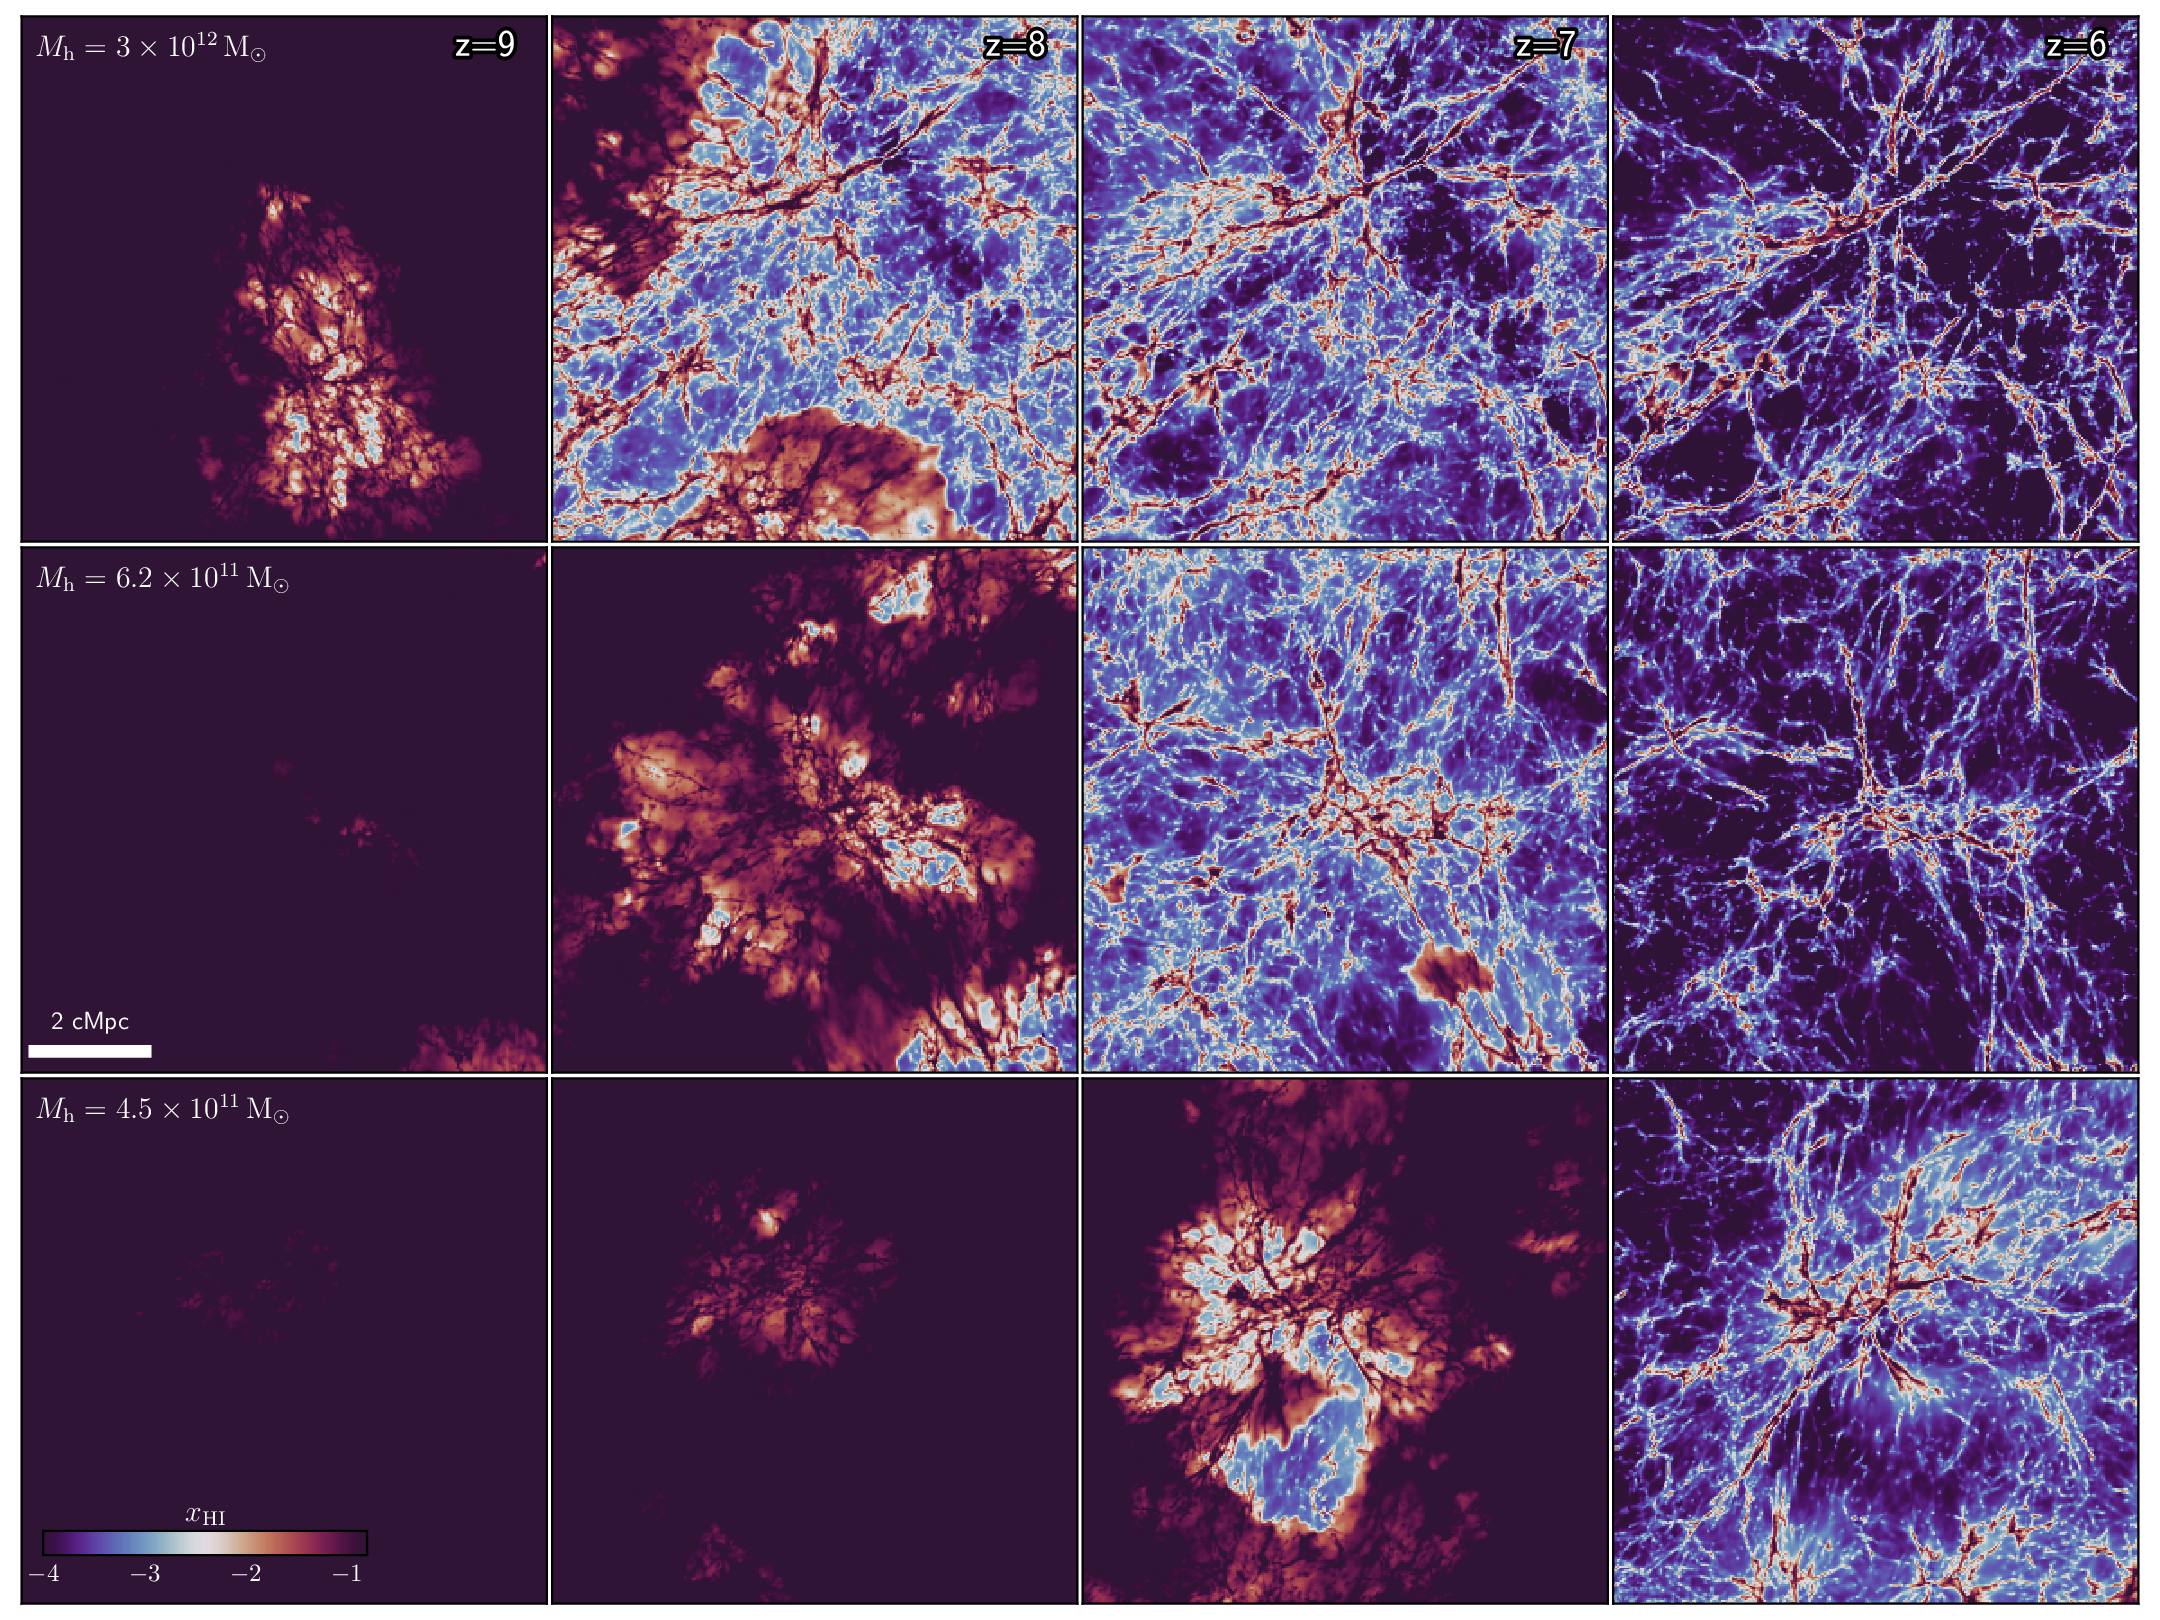
Evolution of the HI fraction around three halos of mass Mhalo=3×10¹²M☉ (top panel), Mhalo=6.2×10¹¹M☉ (middle panel) and Mhalo=4.5×10¹¹M☉ (bottom panel) at z=5.5. The ionization proceeds in an inside-out fashion around these massive halos.
